One of the big news items in the new administration’s proposed budget is that it does not contain the usual “budget dance,” under which the Mayor proposes cutbacks in parks and libraries and then allows the City Council to play the hero by demanding that those services be restored. Given that the New York City tax burden is just about the highest anywhere, as I showed here,
https://larrylittlefield.wordpress.com/2013/07/30/the-state-and-local-tax-burden-fy-2011/
and the fact that space-challenged urban dwellers trade away private amenities like their own backyards, books and automobiles for public amenities such as public parks, libraries and transit, one wonders why elected officials felt free to threaten to take those shared amenities away to begin with. In fact as tax dollars have been shifted elsewhere, generally to retroactively enhanced pensions for powerful public employee unions and past debts run up by Generation Greed, New Yorkers have been told they need to “donate” to their parks and libraries, over and above those taxes, lest they lose them. And now they may be told that there will be a tax on those donations as well, so they’d better donate more.
How high, however, is the city’s local government employment in the Parks and Culture, Libraries, and Sanitation functions compared with other places? How well-paid are the local government employees who do that sort of work in NYC, compared with those doing similar work elsewhere? A series of charts that seek to answer those questions may be found below.
This is one of a series of posts based on data from the employment phase of the Census of Governments. A series of spreadsheets with tables for all the government functions, and an explanation of where the data came from and how it was compiled, may be found here.
Prior posts covered public elementary and secondary education, public higher education, public safety (police, fire, correction), health and social services, and infrastructure employment and payroll. This post is on Parks and Culture, Library, and Sanitation employment and payroll. Let’s start with local government Parks and Culture employment.

The first chart shows full time equivalent (full timers plus part timers scaled to full timers based on hours worked) local government employment in the Parks and Culture and Natural Resources functions (as delineated by the U.S Census Bureau) in March 2012, measured per 100,000 area residents. Although city dwellers, most of whom do not have their own backyards, theoretically have a greater need for public parks than residents of suburb and rural areas, New York City’s local government employment in the Parks and Culture category was just 55, below the U.S. average of 72, the average for the Downstate Suburbs at 96, New Jersey at 62, and Fairfield County, Connecticut at 71. The Upstate Urban counties, at 52, are about the same as NYC, with the mostly rural and small town Rest of New York State lower at 30. In small towns, however, park maintenance may be handled by a general Department of Public Works that primarily maintains roads, and may not show up here.
Most of the other large or dense urban counties chosen for comparison have more local government employment in Parks and Culture, relative to population, than NYC’s 55 per 100,000 residents. These include Los Angeles County at 104, San Francisco at 124, Cook County (including Chicago) at 163, King County (Seattle) at 122, and even Dallas County at 77. Philadelphia, at 48, and Suffolk County (Boston), at 28, are lower. Philadelphia has many historic parks but a broke city government; Boston has less park land relative to population.
The Natural Resources function is generally a province of state governments. New York City doesn’t report any data in the category (with NYC DEP reported with the water and sewer functions), and most local governments report relatively little.

This chart shows state government employment per 100,000 residents in the Parks and Natural Resources categories for New York and selected other states. The data shows that New York State had 14 state park employees per 100,000 residents in March 2012, above the U.S. average of 11 but not by much given the importance of state parks to Upstate New York’s tourist economy. State parks employment per 100,000 residents was higher than New York in New Jersey at 22, North Carolina at 21, Pennsylvania at 20, and Massachusetts at 15, but surprisingly lower than New York in California at 9. Western states, of course, also have far more extensive national parks systems than do northeastern states.
In addition to environmental regulation New York State’s Department of Environmental Conservation also operates campgrounds and natural areas. But the State of New York only had 15 Natural Resources workers per 100,000 residents in 2012, far below the U.S. average of 42. This function also includes state departments of agriculture and forestry, and the regulation of hunting and fishing. And hunting and fishing would appear to be far more popular in most of the other states in the chart than in New York based on state government employment in this category.

Returning to local government employment, one can see that in New York City Parks and Culture was just about the lowest priority of the Giuliani Administration. Rather than tax donations, he just cut money and demanded that city residents donate time to make up for it. From 54 NYC workers in the category per 100,000 residents in October 1992, or just slightly less than the U.S. average at the time, employment fell to just 41 in March 2002, far below the U.S. average of 79. Mayor Bloomberg restored NYC Parks & Culture employment to its former level relative to population by March 2012, despite the “budget dance,” although that was well below the U.S. average that year. Yet this level of employment in no way balances the higher level of usage the city’s parks receive from its space-poor residents.
In the Downstate Suburbs Parks and Culture employment fell from 104 per 100,000 residents in 1992 to 100 in 2002 to 96 in 2012, remaining above the U.S. average and the average for New York City. Parks and Culture employment also tracked downward relative to the population in the Upstate Urban Counties as the fiscal problems of other New York State cities intensified. Once above the U.S. average, these areas are now below average in park workers.

Below average in public parks, New York City’s local government employment per 100,000 residents is also below average in public libraries. The New York City figure is 27 full time equivalent Library workers per 100,000 residents, compared with 41 for the United States, 97 for the Downstate Suburbs, 66 for the Upstate Urban Counties, 33 in the rural and small town Rest of New York State, 53 in New Jersey, and 52 in Fairfield County. Most other major urban counties have higher local government Library employment relative to population, with the exception of those in Texas. Once again San Francisco has the highest employment in the category at 108 per 100,000 residents.
The revolution in information technology has dramatically altered the place of libraries, making them obsolete in some ways but creating a host of different needs and possibilities. This calls for reinvestment, particularly to serve those who cannot afford their own personal computers at home, or need advice on how to use them and where on the internet to access information. I’ll leave it to others more expert to examine the question of whether New York City’s public libraries have received the reinvestment they need to take on their new roles.

While local government Parks and Culture employment per 100,000 residents fell in New York City from 1992 to 2002 and then increased to its former level in 2012, for the Libraries function the city’s local government employment has continued to fall relative to population. It was 53 per 100,000 residents in 1992, more than the U.S. average, and 31 per 100,000 residents in 2002 before falling to 27 in 2012.
In other areas Library employment has been rising relative to population. The Downstate Suburbs had just 19 Library workers per 100,000 residents in 1992 according to the Census of Governments that year, but this increased to 93 in 2002 and 97 in 2012. In the Upstate Urban Counties the increase was from 31 to 55 to 66. In the Rest of New York State it was just 9 to 18 to 33. These figures imply that in many areas of New York State library service became available for the first time in the past 20 years.

The chart above shows that in 2012 the Museums, Historical Sites, Zoos, and Parks industry plus the Libraries and Archives industry, New York City had 145 private sector workers per 100,000 residents, far above the U.S. average of 43. New York City’s private employment in these categories was 102 per 100,000 residents in 1992. Is New York City’s local government Parks, Culture and Libraries employment really that low, or have these services merely been privatized and no longer provided by local government employees?
A substantial share of New York City’s institutions in these industries serve millions of suburbanites and tourists from around the world, not just city residents. Employment at institutions such as the Metropolitan Museum of Art, New York Botanic Garden, Bronx Zoo, the Museum of Natural History and the research library of the New York Public Library hardly substitutes for local government employment at local parks and swimming pools in other locales. New York City’s private employment per 100,000 residents in these categories is about the same as Philadelphia County at 143 and Cook County (Chicago) at 121, and well below San Francisco County at 348 and Suffolk County (Boston) at 295.
On the other hand, New York City does have a number of non-profit organizations operating or contributing to its parks today, beginning with the Central Parks Conservancy and expanding to the High Line, Governor’s Island, the Hudson River Park and the Brooklyn Bridge Park. More specific private sector data on private employment in the “Nature Parks and Other Similar Institutions” is only available on a statewide basis. But the New York State total of 876 is only a fraction of 4,619 full time equivalent local government parks, recreation and culture workers in New York City. Even if all of those private workers were in NYC, and not at places such as Ausable Chasm and Howe Caverns upstate, they would not offset lower public employment in the category.
Privitization, however, may be an explanation for New York City’s relatively low local government public library employment. New York City had north of 2,315 private sector workers in the Libraries and Archives industry in 2012, a significant number compared with the city’s 2,237 full time equivalent local government employees in the Local Libraries category. I e-mailed a librarian at the Brooklyn Public Library and asked whom he worked for. The response was that while much its funding is from the City of New York, Brooklyn Public Library is officially a 501(c)(3) nonprofit organization.
While the city’s libraries may not have a relatively low level of employees compared with other places, however, it is clear that a lack of employees to keep them open has turned New York City’s public libraries into a waste of space (and books and computers). The two branches closest to me are open just five days and 40 hours per week, and it is considered a triumph of city budgeting that after decades with less service they are open that much. But no local business in New York City, where commercial rents are high and space is valuable, would be open that little. To make rent, for example, a food service business would probably need to earn money at breakfast, lunch, dinner, and later in the evening.
Similarly libraries have a potential customer base of the retired, unemployed, parents of toddlers, and those who work at home early in the day, school-age children after school, and workers in the evening. And while every local politician seems to spout the “turn schools into community centers” as if it were a mantra, the City of New York already has facilities around the city that could be used as community centers – the libraries. To serve all those need six days and 60 hours a week is probably more reasonable.
Let’s shift from how many local government parks and libraries workers there are to how much they get paid.

If the overpaid finance sector is excluded, the average payroll per private sector worker in Downstate New York was 28.1% more than the U.S. average in 2012, according to employment and wages data from the Bureau of Labor Statistics. The average payroll per local government full time equivalent Parks, Recreation and Culture worker in NYC was 25.2% above the U.S. average in NYC and 29.6% above average in the Downstate Suburbs, or about what you would expect, according to the Census of Governments. Both private sector pay and local government parks and recreation pay were below the U.S. average in both parts of Upstate New York. Local government park worker pay was, as for other government functions, relatively high compared with the private sector in the big counties in California and relatively low in the big counties in Texas. It seems to be proportional elsewhere.

Local government workers in the Parks, Recreation and Culture category earned more in March 2002, relative to the U.S. average, than they did in October 1992, in New York City, the Downstate Suburbs, the Upstate Urban Counties, the Rest of New York State, and New Jersey. Average pay per worker relative to the U.S. average has leveled off since.

New York City’s local government payroll per employee in the Libraries category was 13.6% above the U.S. average in 2012, a little low given that the average private sector worker in Downstate New York earned 28.1% more than the U.S. average even with the overpaid finance sector excluded. Payroll per employee in the Downstate Suburbs (29.6% above the U.S. average), Upstate New York (4.6% below average in the urban counties and 16.0% in the rest), and most other major urban counties was about the level expected given average private sector pay. Except for relatively low local government pay for librarians in Texas, and relatively high pay in California. As always seems to be the case.

While somewhat low today in NYC, average payroll per local government Library worker is higher than in the past, relative to the U.S. average. It is also higher elsewhere in New York State.
The New York City Department of Sanitation employs more people than the city’s public parks and libraries put together, but that is mostly because it takes far more workers than average to pick up the garbage.

The data shows that New York City had 110 full time equivalent local government Sanitation workers per 100,000 residents in March 2012, more than three times the U.S. average of 33. Not every part of the U.S. has municipal garbage collection, and sometimes where there is publicly-funded collection it is contracted out to private carters. The private Solid Waste Collection industry employed 128,750 people in the U.S. in 2012, according to the Bureau of Labor Statistics. There were 104,700 full time equivalent local government workers in the Solid Waste Management function that year, according to the Census of Governments.
New York City’s local government employment in the category, however, is also high relative to other major urban counties. No other place comes close to its 110 local government workers per 100,000 residents. Philadelphia comes closest at 73. The only counties in New York and New Jersey that are higher than NYC, in terms of local government sanitation workers per 100,000 residents, are rural counties with low resident populations and substantial second home and tourist populations.
Moreover, NYC has 77 more full time equivalent local government Sanitation workers per 100,000 residents than the U.S. average. And just 15 fewer workers per 100,000 residents in the private Solid Waste Collection industry than the U.S. average, at 26 for NYC compared with a U.S. average of 41. In New York City the private carters pick up trash from businesses rather than residents. So the additional number of private sector solid waste collectors in the rest of the country in no way offsets the additional local government solid waste collectors in NYC.

I have long wondered why it takes so many extra people to pick up New York City’s trash. The city’s population is relatively dense, and this should mean garbage trucks and workers have to travel less distance to collect the solid waste of a given number of people. The city has recently added extensive recycling, and this presumably requires more Sanitation workers.
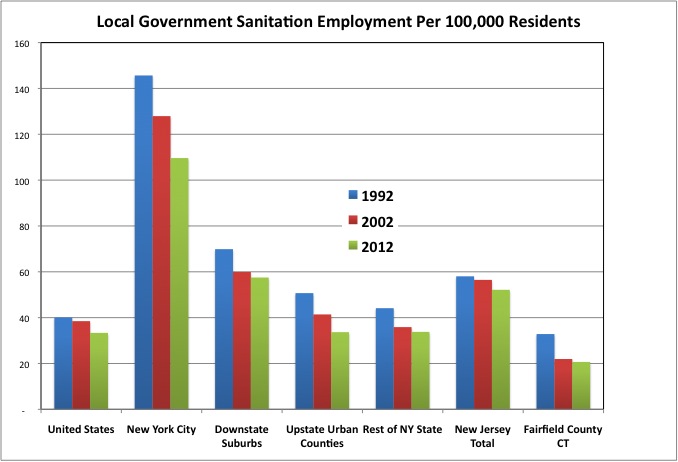
But back in 1992 New York City had 146 local government Sanitation workers per 100,000 residents, even more out of proportion to the U.S. average of 40 at the time. Back then, of course, NYC was actively operating the Fresh Kills landfill and the barge system that served it. Still, while NYC employment in this category remains extremely high relative to other places, at least the gap is shrinking.
This time around I came up with a new idea – street sweeping. Not everyplace has it; most places do not. Could that be the answer? I e-mailed the Department of Sanitation, and received this response. “The New York City Department of Sanitation runs an average of 183 Mechanical Street Sweepers per day 6 days a week.” Let’s say the city’s sanitation workers work an average of 220 days per year, compared with 57,096 sweeper-days over 52 weeks. That works out to about 260 people operating the sweepers if they are out for one shift per day, and 520 if they are out for two. Not enough to explain the difference in full time equivalent employment between NYC and other places, given that NYC employed 9,130 full time equivalent workers in the Sanitation function in March 2012. If it had been 3,000 workers on the sweepers, it might have been a story.
The usual rule when comparing NYC local government workers with the U.S. average is that if they are relatively numerous they are relatively low paid (average private sector pay considered) and if they are relatively scarce they are relatively high paid. NYC’s Sanitation workers, however, are relatively numerous and high paid relative to local government Sanitation workers elsewhere.

The data shows that in 2012 while the average payroll per private sector worker in Downstate New York was 28.1% above the U.S. average with the overpaid finance sector excluded, the average payroll per local government Sanitation function worker was 75.5% above the U.S. average. The figure for the Downstate Suburbs was 36.3% above the U.S. average, closer to what would be expected given average private sector pay. Sanitation workers tend to be highly paid, with the average private sector pay taken into account, in Los Angeles County and Cook County (Chicago). And extremely low-paid relative to the national average in Dallas County and Harris County (Houston) in Texas.
Just because it is the national average doesn’t make it right. New York City may have simply decided at one point that Sanitation workers are underpaid just about everywhere else. Sanitation, it might be believed in NYC, is a job that is worth relatively more but can be bid down to lower pay because there are so many people available who can do it, since there are far fewer jobs these days that require the toughness to work outdoors and the strength to lift things and plenty of people with those abilities. And NYC may have decided at some point that it was unfair to only pay what the market would bear.
What is certain is that compared with their peers, their neighbors have been very generous to NYC’s Sanitation workers. Or their former neighbors, as the Sanitation union got the state legislature to pass a law allowing them to live outside New York City, over the city’s objections.

Whatever decision was made on relative Sanitation pay was made long ago. The average payroll per NYC Sanitation worker was 77.6% above the U.S. average in 1992, and 98.5% above the U.S. average in March 2002, when it might have been temporarily inflated by post-9/11 overtime. Payroll per local government Sanitation function employee has also risen in other parts of New York State, New Jersey, and Fairfield County, Connecticut, compared with the U.S. average, over the years. But employment levels are lower there, with a large share of the trash collection privatized.
I’ll conclude this analysis of data from the employment phase of the Census of Government with a post some general governmental functions.
