For the United States and most parts of it, the decade from FY 2004 to FY 2014 saw soaring public employee retirement costs, and weak growth for taxpayer income. In response to these trends state government assistance for public elementary and secondary schools fell relative to the income of all state residents, and total spending on public schools fell as a share of everyone’s income as well. But there was an offsetting factor. School enrollment fell as a share of the total population, and in many cases in absolute numbers, as the very large “Baby Boom Echo (Gen Y, Millennials) Generation exited school with smaller generations behind them.
At the same time, and perhaps driven by the same demographic shifts, state and local government spending on public higher education increased when measured per $1,000 of everyone’s personal income. But how did different states compare, and how was per-student elementary and secondary school spending affected? That is the subject of this post.
This is yet another post based on my tabulation of FY 2004 and FY 2014 state and local government finances data from the U.S. Census Bureau. The first post, describing where the data comes from and how it was tabulated, is here.
It includes a spreadsheet with data for all data items for all 50 states. A spreadsheet with a table for local government education, and all the charts included in the first part of this post, is here.
And one for state government higher education is here.
The tables include data for all 50 states on education, and at the local level for New York City and the Rest of New York State separately. In the local government spreadsheet I also left in a tab with FY 2012 Census of Governments data, with data on every county in New York State and New Jersey and selected counties elsewhere in the U.S. That kind of geographic detail is not available between Census of Governments years. But for the data that is available, a comparison between FY 2004 and FY 2014 on expenditures per $1,000 of area residents’ income follows.

The data show that U.S. elementary and secondary schools spent $39.60 per $1,000 of all U.S. residents’ personal income in FY 2014. That is 3.96% of the income of everyone in the country was collected up in (mostly) taxes and spent on the schools. New York State ranked fifth in the country at $51.58 per $1,000 of personal income, though according to another data series it ranked first in per-student spending.
New York City was above average at $42.57 per $1,000 of personal income. It would have ranked 18th in the country if it were a separate state. It’s per student spending would also have ranked first, because of the high income of the many childless people in Manhattan, and the low share of its population who are public schoolchildren. The Rest of New York State, if it were a separate state, would have ranked second at $59.40 in elementary and secondary school spending per $1,000 of area residents’ personal income. Behind Alaska, a state where teachers are flown in to teach individual children in the bush. New Jersey ranked 6th at $50.64 per $1,000 of state residents’ personal income. Connecticut and Massachusetts were below the U.S. average.
On the other side, Florida ranked dead last in public elementary and secondary schools per $1,000 of state residents’ personal income at $30.21. Like New York City, that state has its school spending pushed lower per $1,000 of personal income by the income of a large population of non-parents. In this case retirees. Arizona, another retirement state, is second to last at $31.13, and North Carolina is 47th out of 51 (including DC). Other low-spending states, ones that are not generally considered to be retirement destinations, include Colorado, 46th at $32.97 per $1,000 of personal income, an Oklahoma, 43rd at $33.95.

School spending fell when measured per $1,000 of personal income from FY 2004 to FY 2014, for the U.S. as a whole and in every state except Maryland, Wyoming, Delaware, the District of Columbia and Kentucky. The decrease was 12.0% for the U.S., 1.7% for New Jersey, 6.0% for Connecticut, 5.5% for the portion of New York State outside New York City, and just 0.2% — virtually nothing – for the city itself.
There were big reductions outside the Northeast: by 16.2% in Florida, 14.1% in North Carolina, 24.2% in Texas, 2.5% in Oklahoma, 21.2% in California, and 11.1% in the state of Washington. The reductions were 17.1% in Colorado and 19.2% in Arizona. California’s elementary and secondary school expenditures fell 21.2% when measured per $1,000 of personal income. The decrease was 23.2% in Indiana and 29.4% in Michigan.

The big reductions were in elementary and secondary school capital expenditures, outside of New York City and Massachusetts where there were increases. Which makes sense in a way, because if school enrollment is leveling off or even declining, there is not as much need to spend capital dollars building new schools.
As New York and other older cities found out when their enrollment plunged in the 1960s and 1970s, however, existing buildings require reinvestment to be maintained. NYC was left with a space shortage and schools in terrible condition when the Baby Boom echo generation entered in school, even though many NYC parents choose private school or move to the suburbs when their children reach school age. Even if the need for new schools has gone down, all those existing schools were 10 years older in FY 2014 than they had been in FY 2004. On the other hand, in the future a significant re-invention of education based on teachers, students, and information technology might limit the need for brick and mortar schools before high school altogether, as I discussed here.
https://larrylittlefield.wordpress.com/2017/01/15/schools-are-obsolete-ii/

While the big reductions were in capital expenditures, elementary and secondary school current expenditures also fell per $1,000 of area residents’ personal income in most states. In the United States the decrease was from $39.70 per $1,000 of U.S. residents’ personal income in FY 2004 to $36.31 in FY 2014, a decrease of 8.5%. There is, in fact, a long-term trend of elementary and secondary school expenditures rising and falling, relative to personal income, with enrollment. Money following need, in other words, to an extent.
But not in New York, where the provision of public services is at best a secondary purpose of public spending. Current expenditures decreased just 2.0% in New York City and just 0.3% in the Rest of New York State, because of the political power of the teacher’s union here. (Similarly, when NYC school enrollment soared in the 1990s its expenditures per $1,000 of personal income fell significantly, as money was diverted to schools in the Rest of New York State, where spending soared). New Jersey had an increase of 4.8% to $48.50 per $1,000 of state residents’ personal income, while the decreases were just 2.2% in Connecticut and 2.6% in Massachusetts.
On the other end? Some states that got more income from non-parents (oil and gas revenues, retirees, the IT and new media sector) saw their current elementary and secondary school expenditures fall sharply per $1,000 of personal income. The decreases were 14.8% in California, 22.7% in Texas, 15.5% in Kansas, 24.1% in Oklahoma, and 27.6% in North Dakota. For Florida, on the other hand, the current expenditures reduction was just 6.3%, and it was just 9.9% in North Carolina. In the Midwest, meanwhile, despite weak income growth current expenditures per $1,000 of personal income fell by 21.7% in Indiana, 24.1% in Michigan, and 13.8% in Wisconsin. While falling just 5.7% in Minnesota and rising 2.2% in Illinois.
Alarmed, I decided to consult the more detailed Census Bureau data source specifically on public education finances, which includes data on enrollment, to see if falling enrollment explained the cutback in expenditures or if (adjusted for inflation) per student spending was being cut.

That data shows that measured per student and adjusted for inflation, current (not capital) elementary and secondary expenditures increased from FY 2004 to FY 2014 rather than decreased, just about everywhere. The U.S. average increased from $10,386 per student in FY 2004 (adjusted into 2014 dollars) to $11,009 in FY 2014, an increase of 6.0%. The only states with decreases of more than 5.0% was Idaho, at 12.4%, and Indiana, at 8.0%. Current spending per pupil soared adjusted for inflation in some states where oil and gas revenues were rolling in a few years ago – Alaska, up 45.3%, and North Dakota, up 27.6%. But not in others – Texas down 3.5%, Oklahoma up just 1.1%. Colorado cut its school spending by 3.3% per pupil, California by 1.2%, and Arizona by 0.5%. All these states with reductions or limited increases were below the U.S. average in current expenditures per student in FY 2014, some of them well below.
On the other hand, many states with above average current elementary and secondary school spending per pupil had big increases in expenditures per student, often with falling enrollment but rising expenditures. For New York State enrollment fell 7.3% and per student spending rose 27.2%. New Jersey had a 2.5% decrease in enrollment and a 10.1% increase in per student spending. For Connecticut, enrollment fell 8.5% and per student spending increased 31.2%. For New York City, enrollment decreased 5.1% and per student spending increased — 33.5%. To $21,154 per student, nearly double the U.S. average of $11,009. The New York State average was $20,610. It is from these levels of expenditures that those associated with New York’s schools and their unions demand even more money, because the rest of us have cheated them out of $billions they are owed.
Out in the Midwest, in Illinois enrollment fell by 1.1% but current expenditures per pupil increased 20.6%. But in Indiana enrollment was flat as per pupil spending decreased 8.0%. And in Michigan enrollment plunged 22.3% but spending per pupil also fell 2.3%.
I’ll write more using the specific education finances data when 2015 data comes out at mid-year, assuming the data is both released and not scammed by those trying to cover up how high or low their spending is. Since I just quickly grabbed the Census Bureau’s per student spending directly, I was unable to calculate a figure for the Rest of New York State. But using the Government Finances data that is the subject of this post, but the enrollment data from the other source…

Current (non-capital) elementary and secondary expenditures per student increased 6.5% for the United States, 28.1% for New York City, and 22.6% for the Rest of New York State, where enrollment fell 8.6%.
One thing to remember, however, is that the expenditure data for the specific, more detailed public education finances source includes pension and other retirement expenses. So even if total current expenditures per pupil may have been going up when adjusted for inflation, the share reaching the classroom may have been going down. And in fact the FY 2004 to FY 2014 period saw actual education being cut, or at least getting no better, in many places where spending per pupil was soaring, notably New York, New Jersey, Illinois.
Even if there are fewer students to teach, the retirement benefits of former school teachers and other employees remain to be paid. And if those benefits were not properly pre-funded while the retirees were working, or if the benefits were retroactively increased (one, the other or both is true almost everywhere), the cost of the retirees can soar even as the number of schoolchildren falls. And in some places per student spending was going down too. In Michigan school enrollment plunged 22.3% from FY 2004 to FY 2014, as working age parents fled the state’s Great Depression, and current spending per student fell 2.3% after adjustment for inflation.
Large areas of Upstate New York are like Michigan. And this raises a question. Are New York’s public schools an education system? Or are they a high-end welfare system, a jobs program? Public education workers earn more than just about anyone else in Upstate New York, and if jobs are cut there aren’t many alternatives available locally. Teachers and other school employees might have to try to sell their houses and move away, depressing the local economy further.
Data from the Bureau of Labor Statistics shows that from 2004 to 2014 public elementary and secondary school employment fell 2.8% in New York City, while private sector employment, excluding the mostly government-financed Health & Social Services sector, increased 13.9%. In the Rest of New York State public elementary and secondary school employment fell 3.8% while private sector employment, excluding the mostly government-financed Health & Social Services sector, increased just 0.7%. So employment decreased, but not as fast as enrollment.
And retirement costs soared. With enrollment falling, taxpayers leaving, and average private sector compensation no higher Upstate, adjusted for inflation, than it was in 1969, who pays for the extra staff and the underfunded, better off retirees? Perhaps the schools are not so much a high-end welfare program for the connected in Upstate York and the suburbs, as a retirement program for people their 50s and early 60s in Florida. That, and not education, is what all the education debates in New York, where “school reform” has been consigned to the dustbin of history, are really about. It isn’t about the kids, if it ever was.
Since FY 2014 more and more states have started to fess up to how underfunded their teacher pension funds are, and gradually started to shift more and more money from the classroom to the retired. Sacrifices will thus be made over the next decade as a result of the retroactive pension increases and underfunding of two decades ago. And those sacrifices will be much, much greater than they would have been at the time, because of all the investment returns the money that wasn’t there never received. In Oregon, a place that I didn’t even know had a pension problem, one was recently admitted as those in power shifted from hiding the problem to making sure they got paid. From FY 2004 to FY 2014 Oregon’s enrollment increased 3.5% and its inflation-adjusted per student spending rose 4.1%. Things will be much worse of Oregon’s children over the next decade.
http://www.opb.org/news/article/oregon-pers-pension-system-cost-increases/
In the U.S. as a whole, until the Baby Boomers start having grandchildren in large numbers, and those children reach school age, school enrollment is going to be low, leaving less need for teachers other than as a source of jobs, union dues and campaign contributions.
And then in another echo of post WWII demography, enrollment may start rising again. But New York’s history shows that retirement costs from the past will still have to be paid, and all those out of classroom “jobs” that were created when enrollment fell will remain, meaning even more money would be required to provide an education no better than decade ago, if all institutional current arrangements remain in place. Or rising enrollment would just cause the quality of education to plunge further, as in NYC in the 1990s and on the NYC subway today. Because the money is going elsewhere.

Public higher education is generally a state government function, but in some states, notably New York, New Jersey and California, community colleges are counted as local government. Presented in the same scale as local government elementary and secondary school employment, one sees it is not a major cost at $2.48 per $1,000 of New York City residents’ personal income, $3.40 for the Rest of New York State, and $2.53 for New Jersey. In San Francisco they have elected to make community college free.
In New York City, the cost is about $5,200 per year.

Governments Division data shows that tuition and fees cover about 17.2% of the cost of local government higher education in New York City, implying a total cost in excess of $30,000 per student.

With flat or falling school enrollment, most state governments reduced state aid to elementary and secondary schools when measured per $1,000 of state residents’ personal income. So did the federal government, to a level lower than before the “No Child Left Behind” act. (Most of the “school reform” measures in that act are also going away). As noted in my prior post on taxes, many states – particularly low tax states – took advantage of falling school enrollment relative to the overall economy to cut taxes as a share of income.
Other states shifted money to other needs that were growing as the number of schoolchildren, relative to the total population, was falling. In New York State, on the other hand, neither occurred. Both state and local taxes increased as a percent of state residents’ personal income. And additional funding for other needs was not made available. The rising tax burden was apparently offset by falling federal aid in all categories as a percent of New York State residents’ personal income, as New York’s income growth was relatively strong and federal money was shifted to other, less well off states.
Adding it up, federal and state aid to local governments for elementary and secondary school education, when measured per $1,000 of personal income, fell 12.3% for the United States, 14.7% for New York City, 8.2% for the Rest of New York State, 11.1% for New Jersey, 6.2% for Connecticut – and 20.2% in California 30.5% in Oklahoma. This does not necessarily mean aid per student was reduced, but rather that like the number of students state aid rose more slowly than the overall economy, weak as that was.

States, it seems, pay for education, not for pensions, and with enrollment stagnant to falling they paid less. But with pension costs soaring, local government resources expended on elementary and secondary schools increased in many places per $1,000 of area residents’ personal income. The increase was 3.3% for the U.S., 11.5% for New Jersey, 17.6% in California, 8.2% in the Rest of New York State – and 33.1% in New York City. With more than that after FY 2014.
Thus the share of city residents’ income collected up in state and local taxes and used for education continues to rise despite falling enrollment. This trend has accelerated in New York City since FY 2014, based on New York City budget documents although thanks to Universal Pre-K, the reduction in enrollment may have halted or partially reversed.

As a result of falling federal and state aid per $1,000 of personal income and rising local funding, the share of total elementary and secondary school spending accounted for by state and federal taxes, rather than local taxes, fell.
The rest of the analysis is on state higher education.

Spending on this public service, measured per $1,000 of personal income, has always been relatively low in the Northeast, where private colleges and universities were well established before the federal “land grant” program led to the development of state colleges and universities elsewhere. The Census Bureau divides public higher education expenditures into “auxiliary enterprises” such as food services, dormitories, and sports stadiums and “other” – meaning actual education. Auxiliary enterprises are a small share of state higher education expenditures but a high share of higher education employment.
In the U.S. on average state higher education expenditures totaled $17.46 per $1,000 of U.S. residents’ personal income in FY 2014 (1.75% of all of our incomes), with $15.60 for education and $1.86 for Auxiliary Enterprises. Expenditures for New York State, including SUNY and CUNY but excluding community colleges, were $10.83 per $1,000 of state residents’ personal income overall, $10.20 for education, and $0.63 auxiliary. For New Jersey the totals were $11.41, $10.24 and $1.17 respectively.
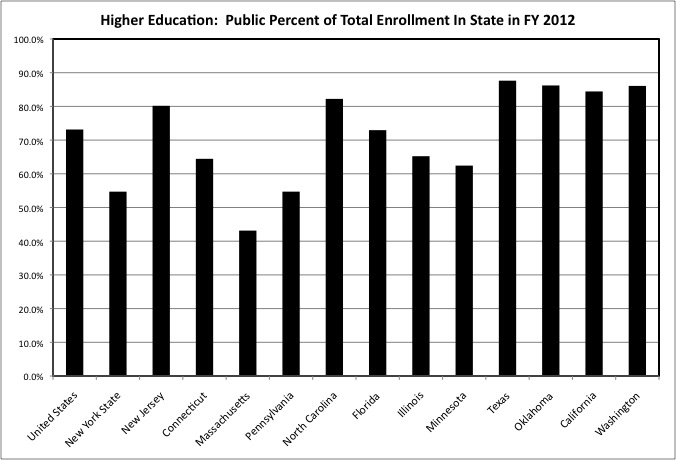
As the chart from my last analysis shows, low spending on public higher education mostly corresponds with a public colleges accounting for a low share of total enrollment in a state. While almost 80.0% of those attending college in New Jersey attend public colleges, a large share of New Jersey residents attend private colleges out of state, notably in Upstate New York and Massachusetts.
The big issue in higher education is why are students so burdened by its cost? Is that cost rising rapidly, as it has been for private colleges and universities? Or is tuition soaring due to falling state subsidies, leaving students with a larger share of the bill? I continue to find the evidence to be mixed.

State higher education expenditures did rise by 9.3% when measured per $1,000 of personal income from FY 2004 to FY 2014, and than came at the end of a long period of rising expenditures. But among the states I chose to compare with New York there were many examples of limited increases or outright declines relative to personal income. The higher education system of Massachusetts, with a 32.7% increase, was the big gainer, but that might just reflect rising enrollment by out of state students.
The increase for New York State was just 1.6% when measured per $1,000 of personal income, despite relatively strong income growth. And the anecdotal evidence, based on what you read in the media, is that New York politicians, who for any other public service are constantly pandering to producer interests by asserting that New Yorkers ought to pay more or accept less, seem determined to squeeze public higher education for a better deal. It seems to be the only service where the service recipients and taxpayers actually matter. Particularly in comparison with other states, where huge money is spent on stadia and successful coaches and star professor-researchers are often the highest paid public employees in the state.

Cashed strapped students have the option to commute to school. Expenditures on the actual education portion of public higher education also increased when measured per $1,000 of personal income, by 8.3% for the U.S, 5.9% for New York State, 7.4% for Connecticut – and 29.3% for Massachusetts.
North Carolina cut spending on this public service by 14.2% over a decade. Once above the U.S. average in spending on public higher education, that state is now below. There was also a big decrease in California. Given these spending reductions, it is possible that public universities in these states are not what the once were. Michigan increased its higher education spending per $1,000 of the plunging income of state residents by 16.0%.

On the other hand, North Carolina has a big increase in expenditures on “auxiliary enterprises” per $1,000 of its residents’ personal income from FY 2004 to FY 2014. The football team finished with an 8-5 record this year. In New York State, expenditures on auxiliary enterprises” went down compared with the income of state residents, in addition to being relatively low. As for the U.S. average, expenditures per $1,000 of personal income increased 18.2% from FY 2004 to FY 2014. What makes this surprising is that the past decade has seen the large-scale entry of private real estate companies into the student housing market, generally with the invitation of public colleges and universities that lacked the funds to build new dormitories and cafeterias. Auxiliary expenditures by students at private facilities are not counted in this data.

Expenditures have gone up somewhat. But state government higher education tuition and fees actually fell as a percent of expenditures on actual expenditures from FY 2004 to FY 2014, from just 32.4% to just 31.2%. For New York State the decrease was greater, from just 22.8% to 18.3%. Once again, New York seems to offer a better deal, though perhaps at the cost of students having to attend CUNY or SUNY for five years rather than four because not enough staff is available for all students to attend courses required for their majors.
In other states, notably those with more out-of-state students, the percent of costs covered by tuition is higher. In California it was 41.8% in FY 2014, down from 43.8% in FY 2004, in Massachusetts it was 40.1%, down from 43.3%, and in Vermont it was 48.2%, down from 49.3%. A high and rising share of state higher education expenditures covered by tuition and fees seems to be something that happened in just a few states. Pennsylvania at 46.7% in FY 2014, up from 40.8% in FY 2004. Colorado at 44.5%, up from 40.6%. Delaware at 52.9%, up from 43.7%.

It may seen strange that in some cases students pay more than 100 percent of state government expenditures on higher education auxiliary expenditures, but unfortunately those expenditures do not include debt service, which is mostly just lumped together in this dataset. In any event, fees paid by students covered a high but falling share of auxiliary enterprise expenditures from FY 2004 to FY 2014, with the decrease perhaps due to a building boom and rising interest payments. For New York State, where there has been less construction and reconstruction, the share of expenditures covered by fees increased.

Scholarships and subsidies are state expenditures on students attending both private colleges and universities and public colleges and universities. Given that a relatively high share of New Yorkers attend private colleges and universities, one might have expected New York’s state expenditures in this category would be relatively high as a share of the income of state residents, compared with the U.S. average, and rising. But New York was relatively low in FY 2014, and down from FY 2004. The U.S. average was $2.09 in state expenditures on higher education assistance and subsidies per $1,000 of personal income in FY 2014, up from $1.61 in FY 2004. New York State was $1.58 in FY 2014, down from $1.83. Most other states had increases. In New York State, most expenditures in this category are in the TAP program (Tuition Assistance Program).
Even so, with mixed data on the level of state spending on higher education, and the share covered by tuition and fees, I continue to believe that the factors no one ever talks about are a big part of the story in the student debt crisis. Lower payments by the students themselves, because jobs for teenagers have become less available and paid work before college graduation less common and less well paid. And lower payments by parents, as a result of their own falling wages, rising debts, divorce, single parenthood, and other spending priorities.
I will now turn to other government functions using data from the Government Finances series. And will later review public elementary and secondary school spending in more detail, when the more detailed public education finances data comes out for FY 2015. But I just realized something. If the public schools can provide more detailed data every year, why not other public services?
Every school district reports far more detailed revenue and expenditure data to the federal government every year. With wages and salaries separate from benefits, for both instructional and non-instructional workers, with non-instructional workers in detailed categories, and data on interest payments just for schools.
For other public services, for the government finances data, New York City reports pension contributions, other benefits, and most interest payments in one lump sum. And while NYC reports every year, all local governments only report in Census of Governments years, with just a sample in other years. And the public education finances data for a given year comes out sooner than the general Government Finances data. Let’s just hope that in this “fake news” era things are not equalized by making the public education finances data worse.
“In cases where more uniform standards make more sense, the regulations require them. Republicans say they are staunch defenders of transparency in education. If so, why repeal a rule requiring education departments to use the same formula when reporting per-student spending? As things now stand, schools can use all manner of different number-crunching practices, making comparison difficult.”
A post on aid to the needy will follow.
