Remember school reform? The idea that funding for public schools, in New York City and across the country, would be increased, and in return the kind of education those schools were expected to provide would rise as well, even for poor and disadvantaged students. “No child left behind.” Republicans such as George W. Bush were in favor, but so were Democrats such as Teddy Kennedy and Barack Obama. But nobody talks about it anymore, and for good reason. In New York City, and some places like it, the schools – and the teachers union — grabbed vastly more money, but once that was locked in they rejected any increased expectations, or any expectations at all, and have since demanded still more money. In some other states anti-tax politicians reversed higher school funding, though not completely, and left the quality of education lower than it had been decades ago.
Nationwide the reversal was driven by three trends. Since FY 2007, with the children of the Baby Boomers (aka the Millennials) exiting school, public school enrollment has been falling in many places, and barely increasing nationwide. So the only generation that matters, the Baby Boomers, wants money and attention shifted to other things — even as the schools and the politicians they support, in places like Upstate NY, want more money funneled through the increasingly empty schools as a jobs and retirement program. Throughout their adulthood, this generation either failed to fund the pensions teachers had been promised, or retroactively increased those pensions to benefit the generations cashing in and moving out – themselves. As a result much of the increase in school funding per student that did occur actually went to retired school employees, rather than to the classroom. All this came to a head with the Great Recession, followed by a perpetual fiscal crisis across the country. One associated with falling tax burdens in some places, but rising tax burdens in New York. School reform is over across the country, but in New York City it was probably a fraud to start with.
This is a second post on comparative public school spending in FY 1997, FY 2007, and FY 2017 for New York City compared with other areas of the state, nearby states, the U.S. average, and selected other locations. The first post, with links to allow spreadsheets with tables for all school districts in New York and New Jersey and other areas to be downloaded, is once again here.
This post will provide the same information, but in words and charts rather than in tables, and add some comments on why what happened might have happened.
The data shows that despite the unchallenged propaganda we get in the media here, spending on public schools per student has soared, in New York City and other parts of New York State, to an absolutely shocking degree. Even as most people keep getting poorer, generation-by-generation, and other public services are neglected, despite the highest state and local tax burden in the country.
What has happened is a social injustice on par with what C-suite executives have done to American business, and the financial sector has done to the U.S. economy. And as a result the New York State United Teachers (NYSUT) and New York City United Federation of Teachers (UFT) are desperately trying to prevent simple factual information about how much is being spent, and how this has changed, from becoming widely known. It isn’t easy to try to summarize 20 years of public school expenditures and revenues in one post, but I’m going to try. If you want the forbidden knowledge, read on.

In FY 2017, New York City spent $28,495 per student on its public schools, more than the average for the mostly affluent, high-spending Downstate New York Suburbs ($27,196), more than the average for New Jersey ($21,003), more than the average for Connecticut ($21,095), more than the average for Massachusetts ($18,047). And within Connecticut, more than the average for Darien ($22,201), Westport ($24,432) and Greenwich, home of the hedge fund managers ($25,304).
On “instructional” (ie. teachers) wages and benefits alone, New York City spent $16,998 per student, which is $339,967 per 20 students, and $203,980 per 12 students. This is the average – some, particularly those with less seniority and in lower pension tiers – get less, but others get more.
Just for comparison, the median New York City resident with a college degree alone earned $60,656 in cash wages, salaries and/or self-employment income in 2017, according to the Census Bureau’s American Community Survey, down 0.8% from a decade earlier after adjustment for inflation. The median worker with a graduate degree earned $77,184, down 3.5% over a decade – and a teaching degree is the easiest graduate degree to get. New York City teachers start at $59,000 per year, I have read, and NYC teacher benefit costs equal a stunning 63.2% of their wages and salaries.
New York City’s instructional wages and benefits at $16,998 per student compares with an average of $15,888 for New York’s Downstate Suburbs, $9,179 in New Jersey, $9,982 in Connecticut, and $8,579 in Massachusetts – little more than half the level of New York City. Although, in fairness, New Jersey and Connecticut’s per student spending would likely be higher if they were actually paying for their deeply underfunded teacher pensions. But in more fairness, NYC teacher pensions are also vastly underfunded, despite NYC taxpayers putting in far more over the decades.
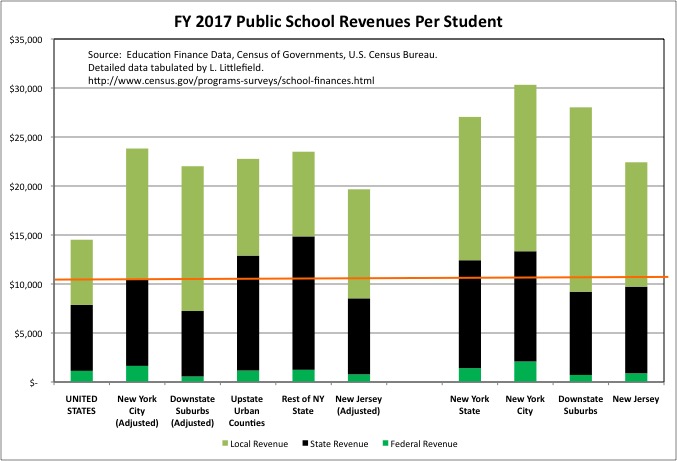
These are all relatively high-wage, high cost of living areas along the Northeast Corridor. For dollar (rather than percent change) comparisons with the U.S. average and Upstate New York, I adjust their revenues and expenditures per student downward based on what the average private sector worker earned in each area, as explained in the prior post. With a very generous adjustment, spending in NYC and the Downstate suburbs is multiplied by .786. The next chart is simplified to show adjusted data only, as are most of the rest.

With the adjustment, total NYC school expenditures fall to $22,386 per student and the average for the Downstate suburbs falls to $21,366. That compares with a national average of $14,202 per student. NYC remains 57.6% higher. But NYC is about the same level as the averages for not only the Downstate Suburbs but also the Upstate Urban Counties ($21,646) and the Rest of New York State ($22,957).
The finding is the same as in other recent years. When an adjustment for the cost of living is applied, all broad areas of New York State have about the same per student school spending – at a level that is far higher than any other state in the country. Although there is wide variation among school districts within other parts of the state.
On instructional (teacher) wages and benefits alone, New York City spent $13,354 after downward adjustment. That is higher than the $12,482 for the Downstate Suburbs, the $11,709 for the Upstate Urban Counties, and the $12,179 for the Rest of New York State. And it is 107.7% higher (more than double) the U.S. average of $6,430 per student on teachers. More than double the U.S. average – after a large downward adjustment for the higher cost of living here.

One finds that total public school spending per student spending in the Upstate Urban Counties ($21,646) and the Rest of New York State ($22,957) is higher, in some cases vastly higher, than the average for Maryland ($16,528), Pennsylvania ($19,171), Ohio ($14,507) and Vermont school districts with at least 5,000 students ($19,862). And instructional wages and benefits per student, at $11,709 for the Upstate Urban Counties, and the $12,179 for the Rest of New York State, is far higher than the average for Maryland ($7,949), Pennsylvania ($9,062), Ohio ($6,527) and Vermont school districts with at least 5,000 students ($8,586). None of these places that I am comparing with Upstate New York are Alabama.
The data also shows that even after New York City’s total spending is adjusted down to $22,386 per student, it is still vastly higher than the per student spending in Chicago ($15,118) and Los Angeles ($15,313) or for that matter all of California ($14,343), hardly a low cost of living state. New York City’s instructional wages and benefits per student, at $13,354 after downward adjustment, is vastly higher than Chicago ($7,208), Los Angeles ($6,504) and California as a whole ($6,137). Double Los Angeles, in fact. One might have heard about teachers going on strike because of perceived unfairness in other parts of the country. In New York City and the rest of New York State, there is so much unfairness in the other direction that the people should be going on strike against the teachers.
Now let’s use the very same scale to show spending in FY 2007, adjusted upward to $2017 dollars. Since the same scale is used, the bars are all much lower, because spending was much lower back in FY 2007.

The New York City schools already had more than enough money to provide a good education in FY 2007, at $22,917 per student, although the average for the Downstate Suburbs was higher at $24,556. The $13,252 NYC spent per student on instructional wages and benefits alone was $265,048 per 20 students and $159,029 per 20 students at the time. Meaning without excessive absenteeism and out of classroom assignments, NYC teachers could have already been getting vastly more in compensation than other New York City workers, even highly educated New Yorkers, receive. Aside perhaps from those pillaging on Wall Street. After downward adjustment for the cost of living, NYC’s total expenditures per student was $17,277 in FY 2007, already 26.5% higher than the U.S average at the time. NYC’s per student expenditures on instructional wages and benefits was $10,016 per student, already 63.6% higher than the U.S. average.
Now use the same scale to show FY 1997 public school expenditures per student, adjusted for inflation into $2017. This data is from back when I was prepared to argue that the New York City schools needed more money, and its teachers deserved higher cash pay. The teachers’ unions, various interest groups and the media keep saying the same things now, as if nothing has changed. Debating only about which politician should force New Yorkers to stop cheating those working in public education and give them more money.
Has nothing changed?

Back then New York City’s per student spending was just $11,150 after downward adjustment for the cost of living, barely higher than the U.S. average of $10,483 and lower than the Downstate Suburbs (adjusted $14,590), the Upstate Urban Counties ($13,298), the Rest of New York State ($13,984), and New Jersey (adjusted $12,611) though still higher than Connecticut (adjusted $10,919) and Massachusetts (adjusted $10,223). It was also higher than Chicago ($10,302) and Los Angeles ($8,764). New York City’s instructional wages and benefits were as high or higher than Massachusetts, New Jersey, Connecticut, and other areas even back then, but lower than the averages for other areas of New York State.
In the mid-1990s, the Campaign for Fiscal Equity lawsuit asserted that the City and State of New York were underfunding New York City’s relatively high needs schools, with an unfair school aid formula that favored school districts in other parts of the state. One response from those representing other parts of New York State was that New York City’s schools were inefficient, blowing money on administration and other non-instructional expenditures. That wasn’t true then.

In FY 1997, the data shows, it was other parts of New York State and New Jersey where non-instructional expenditures per student were far higher than the U.S. average. New York City was only slightly higher than the U.S. average on student transportation and operation and maintenance of plant (ie. custodians) combined. Despite local scandals in both categories with regard to automatically renewed sweetheart contracts with private school bus companies, who were among the leading campaign contributors to the old New York City Council, and corrupt and abusive labor practices by NYC school custodians. Both of which had been in the news for decades.
For every other category of non-instructional spending, and non-instructional in total, NYC’s per student spending was very low. While in other parts of New York State, with their many small school districts each with their own administrative staff, non-instructional spending was very high.

After adjustment for the cost of living and for inflation into $2017, New York City’s non-instructional expenditures were still lower than the U.S. average in FY 2007, and far lower than in other areas of New York State, and nearby states. The Bloomberg administration attempted to crack down on the cost of the school buses and school custodians, but the cost of these services still soared relative to the U.S. average. NYC’s per student expenditures on administration and pupil support were cut even more to make up for it.

As of FY 2017, however, even after a downward adjustment for the cost of living, New York City’s non-instructional expenditures per student, at $4,783, is no longer low compared with the U.S. average of $4,795. NYC’s non-instructional expenditures remain lower than the Downstate Suburbs (adjusted $6,634), the Upstate Urban Counties ($6,805), the Rest of New York State ($7,051), and New Jersey (adjusted $8,052), Connecticut (adjusted $6,660). Massachusetts (adjusted $4,909) was comparable to New York City and the U.S. average.
New York City’s per student spending on school transportation, adjusted down to $995 per student, was nearly double the U.S. average of $508, even though New York City’s children are more likely to walk to school that students in most places. The DeBlasio administration has brought the school bus companies and employees back into the deal that has those connected with the government paid vastly more than other New Yorkers for the same work, at the expense of those less well off serfs.
The same may be said of the operation and maintenance of plant category, with a per student spending level of $2,104 per student in NYC after adjustment downward, compared with a U.S. average of $1,110. Also double. In this category, NYC’s spending per student also exceeds that of the Downstate Suburbs ($1,672), the Upstate Urban Counties ($1,402), and the Rest of New York State ($1,444), as well as New Jersey ($1,654), Connecticut ($1,421), Massachusetts ($1,106). Even though, like the city’s housing occupants and office workers, the city’s children are squeezed into far fewer square feet of space each than children elsewhere. And New York City school custodians don’t have to mow the lawn.

What has happened is that New York City’s inflation-adjusted expenditures per student doubled from FY 1997 to FY 2017. Doubled! From $11,150 per student in FY 1997, after downward adjustment for the cost of living and upward adjustment for inflation, to $22,386 per student in FY 2017, after the cost of living adjustment. Without adjustment the increase was from $14,312 to $28,495.
Remember this has been a time when the compensation of most workers was falling behind overall inflation in NYC (and workers in much of the U.S. fared even worse). In fact, recent reports show that nationwide, adjusted for inflation, Millennials are being paid about 25.0% less, on average, than Baby Boomers were at the same age, despite higher educational attainment.
It is these lower paid generations who are having to carry twice the school cost per student, in higher taxes and lower funding for other services, such as housing, public hospitals and mass transit. New York City’s high tax burden as a percent of its residents’ personal income increased further during these years.

New York City’s per student expenditures increased 54.9%, adjusted for inflation, from FY 1997, the time of the Campaign for Fiscal Equity lawsuit, to FY 2007, during the so-called “school reform” era. And another 28.6% from that higher base in FY 2007 to FY 2017, leading to the doubling.
The spending increases for other parts of the state were also huge during these years, though not quite so huge as in New York City. While NYC public school spending per student doubled from FY 1997 to FY 2017, it increased 46.4% in the Downstate Suburbs, 62.8% in the Upstate Urban Counties, 64.2% in the Rest of New York State, 46.3% in New Jersey, 72.5% in Connecticut, and 41.1% in Massachusetts. The increase was 48.2% over 20 years for Vermont school districts with 500 or more students, 43.1% in Pennsylvania, and 35.5% for the United States.
U.S. school spending per student, adjusted for inflation, increased 30.3% from FY 1997 to FY 2007, during the “school reform” era, but then just 3.8% from FY 2007 to FY 2017 – despite ongoing huge increases in places such as New York City.
In some states and areas public school funding per student fell from FY 2007 to FY 2017, after adjustment for inflation. The school spending decrease was 22.6% for Florida, the state with the lowest state and local tax burden as a percent of residents’ income in the country (with much of even that carried by sales taxes on tourists and property taxes on second homeowners). In that state, the tax burden is down from the 1990s.

The biggest increase in expenditures in New York City was in instructional employee benefits, mostly retirement benefits for teachers. As I noted in this post using Census Bureau data to compare public employee pensions across 50 states over 44 years…
No taxpayers and public service recipients have paid more, and sacrificed more, for public employee pensions than the taxpayers and service recipients of New York City. And yet New York City’s public employee pensions are among the most underfunded in the country, as a result of deal after to deal to increase benefits beyond what the employees had been promised. Increasing payouts, reducing their own contributions, and reducing the years they have to work while increasing their years in retirement – and years receiving retiree health care before Medicare picks up much of the bill. And among New York City public employees, none has played the pension increase game as ruthlessly and recklessly as the United Federation of Teachers.

In $2017, New York City’s instructional employee benefits cost $1,745 per student ($34,900 per 20 students) in FY 1997. That nearly quadrupled to $6,585 per student ($131,700 per 20 students) in FY 2017. An increase in cost that, if one examines the attitude of NYC teachers toward the fairness of their compensation as described in the media, doesn’t exist, and that no politician who doesn’t want to have their career ended by $millions in negative propaganda dares to bring up.
The increase was 136.6% from FY 1997 to FY 2007, due to a long run of pension increases. The largest, and the one that affected all public employees in New York State, was in 2000, which cut the contributions teachers had to make to their own pensions and jacked up the benefits already-retired teachers were getting, causing NYC teacher pension plan payouts to rise by 51.7% more than inflation in one year. Then there were a series of pension “incentives,” allowing teachers who had been promised a retirement at 62 after 30 years of work to retire at 55 after 25 years of work instead.
Then, in 2008, even though benefit costs had already soared, the UFT ordered the Mayor, state legislature and Governor to allow all teachers to retire at age 55 after 25 years of work.
That’s ten years of retiree health care before Medicare rather than three. And based on recently released actuarial tables that shows the average female teacher with a pension lives to age 90, that is 35 years of paid leisure for 25 years work.
The Society of Actuaries Releases Public Retirement Plans Mortality Tables, Pub-2010
NYC instructional employee benefit spending per student increased another 59.5%, adjusted for inflation, from FY 2007 to FY 2017. (With adjustment for the cost of living that was actually a 65.8% increase, because other New York City taxpayers are not as rich, relative to the U.S. average, as they had been, so the downward cost of living adjustment is shrinking). But the truth is we have not yet begun to pay for the cost of all the pension increases. The cost is still being pushed off into the future.
New York City is not the only place where instructional benefit costs have soared. There has been some combination of unfunded, fraudulently described retroactive pension benefit increases, and underfunding of the pensions teachers had been promised to begin with, just about everywhere in the U.S. other than Wisconsin and Washington DC. While NYC instructional benefit costs per student soared 277.3% from FY 1997 to FY 2018, the increase was 112.3% for the Downstate Suburbs, 154.3% for the Upstate Urban Counties, and 151.5% for the Rest of New York State. (Remember, a 100 percent increase is doubling, and these figures are adjusted for inflation).
The U.S. increase was 83.3% over 20 years, along with 98.8% in New Jersey, 101.3% in Connecticut, 143.2% in Massachusetts, 120.8% in Vermont districts with 500 or more students, and 129.7% in Pennsylvania. Many of these areas are facing additional increases in the future.
Retroactive pension increases happened in many places around the year 2000, with the dot.com bubble as an excuse for claiming they “cost nothing.” Only in New York State do such increases continue right to this day, even after pension costs have soared. Underfunding, however, continues to occur everywhere, as neither public unions nor politicians want to fess up and fully impose the suffering resulting from their past self-dealing. That just makes it worse later on.
One thing public unions and politicians have agreed to do is slash the pay and benefits of new teachers to fund the increase benefits of those cashing in and moving out.

Nationally, inflation-adjusted instructional (ie. teacher) wages and salaries per student had increased 16.8% from FY 1997 to FY 2007, during the “school reform” era. The increase was 59.3% for New York City, 17.1% for the Downstate Suburbs, 11.6% for New Jersey, 19.1% for the Upstate Urban Counties and 19.4% for the Rest of New York State. (I’m using the figures unadjusted for the cost of living for the percent gain in the text, but the charts are based on adjusted data).
Back in FY 1997 New York City teachers were paid less than teachers elsewhere, but they also worked less than teachers just about anywhere, with more out of classroom assignments, more work actually done by paraprofessionals, more preparation periods so less work would need to be done at home, more half days. A contract during the Bloomberg Administration increased teacher pay by 20.0% in one year in exchange for ending some of these deals.
Then, in a political deal in exchange for support from the UFT, all those deals came back. This has lead to higher level of staffing relative to enrollment, as students per instructional employee fell south of eight New York City, in a school district with an average class size of 27. Total NYC instructional wages and salaries per student increased by 14.1% adjusted for inflation from FY 2007 to FY 2017, even as individual teachers faced years of wage freezes. The U.S. average fell by 0.5%. The increase was 10.4% for the Downstate Suburbs, 11.2% for the Upstate Urban Counties, and 9.2% for the Rest of New York State.
Total per student wages and salaries continued to rise in New York even as the pay of most workers, the taxpayers, fell behind inflation – and teacher wages and salaries per student fell in many areas. Including New Jersey where it fell by 2.2%, the Los Angeles school district where it fell 8.0%, the Colorado average, down 8.0%, the Florida average, down 15.9%, Miami-Dade County, down 26.2%, and the Oklahoma average, down 18.1%, and the city of Chicago, down 6.8%. Through some combination of individual teacher pay falling behind inflation, and larger class sizes.
Everywhere the teacher’s unions gleefully signed off on lower pay and benefits for new teachers, and cuts in education services, to fund the underfunded retirement benefits of those cashing in and moving out. But then the Supreme Court held, in the Janus decision, that teachers didn’t have to pay union dues if they didn’t want to. Suddenly younger and later-hired teachers, on the wrong end of the “screw the newbie, flee to Florida” deals, didn’t have to pay the unions that cut those deals.
That is why the teacher’s unions are now desperate to force someone else to pay the price for the deals they did in the past. And to get more dues paying members on the payroll, for more dues revenues to fund the pensions of people who work for the unions themselves. By taking away the charter school alternative, for example. All this as enrollment has stagnated in the U.S., and plunged in places where overall population growth isn’t unusually high. Including New York City.

One reason instructional wages and salaries per student are up is that the money provided to the schools is really money for dues paying members and campaign contributors, and that money is the same whether enrollment is going up – as it was in NYC in the lead up to FY 1997 – or down as it has been in NYC since FY 1997 and has been in most places since FY 2007. Leaving less money for public services where there is more actual need today.

With fewer students the costs that were shifted to the future in the past – through retroactive pension increases and pension underfunding – continue to soar per student, and compared with the wages and salaries still on the job. With no end in sight. As noted previously, for instructional employees the cost of instructional benefits is now and incredible 63.2% of the cost of instructional wages and salaries in New York City, and rising. Despite all the additional wages and salaries of those additional paraprofessionals hired and extra teachers shifted to non-teaching non-work assignments, to get payroll up. I was surprised to find that the average for the State of Pennsylvania is also over 60.0%. As of FY 2017, instructional benefits were still just 38.8% of instructional wages and salaries in California, where the pension issue is not under Omerta. But that state is facing a huge increase. The public unions have demanded that the Brookings Institution be de-funded for talking about it.
California’s pension debt is harming teachers and students now—and it’s going to get worse
In 2014, California passed legislation designed to put it on a path to pay down the CalSTRS debt. At the time of the legislation the total contribution to CalSTRS—on a per-teacher basis—was about 18% of salaries (paid by three parties: employees, school districts, and the state). The legislation was to phase in rate increases through 2021 that would result in a total contribution rate of just over 35% of teacher salaries…The most recent projection is that the contribution rate will plateau at around 38% of teacher salaries, and again this rate will carry forward through 2046 …In principle this number could be revised upward or downward in the future, but based on the history of CalSTRS and other similar plans nationwide, my bet is that it will be revised upward.
That’s just for pensions, with more for retiree health insurance and other benefits for active and retired employees. NYC’s taxpayer pension contributions for teachers was already higher than 38.0% of wages and salaries in FY 2016, and I’ll bet it will be going up more too. And in NYC, unlike California, teachers also get Social Security, and all their retirement income is exempt from New York State and New York City personal income taxes, no matter how that income is, no matter how high total income is, no matter how young they get to retire and new do anything for anyone else ever again. No matter where you look, nothing compares with NYC.
In low-tax Texas, meanwhile, instructional employee benefits were only 12.2% of instructional wages and salaries in FY 2017. Shockingly low. Are school districts in that state fully funding teacher pension benefits at that rate, or is this yet another fiscal time bomb that will go off someday? You know the way to bet.

Adding it up, total NYC instructional compensation per student increased by 127.5% from FY 1997 to FY 2017, far more than doubling. The increase was 28.8% for the United States, 46.9% for the Downstate Suburbs, 57.5% for the Upstate Urban Counties, 56.8% for the Rest of New York State, 22.2% for New Jersey, 35.4% for Connecticut, 48.1% for Massachusetts, 39.4% for Pennsylvania, and 46.6% for Vermont districts with 500 students or more.
But total instructional compensation per student fell 0.4% in low-tax Florida, and 13.0% in the Miami-Dade school district, and increased just 10.2% in Colorado, 2.6% in Oklahoma, and 16.9% in Texas, over two decades.

In straight dollars rather than percent increase, one finds that (with a downward adjustment for the cost of living) New York City’s instructional employee benefits per student increased by $2,053 from FY 2007 (in $2017 dollars) to FY 2017 (or $41,060 per 20 students). Compared with an increase of $1,285 per student (or $15,420 per 20 students) for instructional wages and salaries per student in NYC. Again, these are the increases over and above inflation, during a period when NYC teachers were faced with what were officially described as zero percent pay increases for several years. Yet somehow the total amount paid per student went way up.
While NYC non-instructional expendituresincreased by $1,255 per student in total, about as much as instructional wages and salaries, within non-instructional the cost of employee benefits increased by $319 per student while wages and salaries increased just $235.
Other areas show much smaller increases – not much at all for the U.S. as a whole – but the same pattern, with benefit costs rising more than wages and salaries. Except in the Downstate Suburbs and Connecticut, where instructional wages and salaries per student increased faster than instructional benefits.
With enrollment falling, capital expenditures per student fell in most places, but not in New York City. And not in rural areas of Upstate NY, where the state is paying to rebuild school buildings all over the state.

These massive increases in school spending in New York City are in stark contrast with the pay and benefits of the other workers forced to foot the bill. From 2007 to 2017, while total NYC public school expenditures per student increased by 24.7% after adjustment for inflation and instructional compensation per student (wages and salaries and benefits) was up 28.3%, the median earnings of NYC’s resident workers in general fell behind inflation, with the less educated faring the worst. Median earnings also fell behind inflation in the U.S. as a whole.
“Tax the rich” might have seemed like a solution before the financial crisis, but from 2007 to 2017 mean payroll per wage and salary worker in Downstate New York’s finance and insurance sector actually fell 5.2%. An actual “progressive” might find that it is still bloated, with further to fall. Mean payroll per worker in the rest of Downstate’s private sector managed to increase 2.0%, but only because actual employees have become a relatively privileged group – as more and more workers have been forced to become freelance workers, contract workers, and temps.
As for per capita income, it is up adjusted for inflation, but only because a smaller share of the population consists of non-earning little capitas – and schoolchildren – and a higher share consists of workers. Whereas an apartment might have held a family with two children ten or twenty years ago, there are now four working roommates. Per capita income is therefore up even though pay per worker is down. In fact, now that the UFT/NYSUT have established $28,000 per student plus as the level of NYC public school spending required for — the schools to be cheated out $billions by NYC taxpayers based on the Campaign for Fiscal Equity lawsuit — it is only because where are fewer such students and more taxpayer to pay for them that NYC hasn’t gone bankrupt.
The fact that other New York City workers have been getting less is exactly what makes what New York’s public school employees get worth more, by keeping down the cost of their goods and services. If everyone were entitled to retire at 55 and then be retired for 25 or 30 years, then everyone would be poor, throughout their working years and retired years, to pay for all those retirees. New York City school employees “vote” for lower pay and benefits for other NYC workers every time they go shopping, because in the marketplace no one forces them to pay.
That’s why the public unions fought Obamacare. Why pay more in tax for other workers to get what they already have? The unions insisted on being left of out of New York State’s family leave program, which workers pay for themselves in higher payroll taxes, to get even richer family leave benefits for themselves. It is also why the public employee unions are fighting against campaign finance reform in the state legislature, which might eventually reduce the extent to which they own that legislature.
“We understand the sentiment for public financing, but we don’t need that,” Michael Mulgrew, the president of the United Federation of Teachers, which represents New York City teachers, said in an interview.
http://nytimes.com/2019/04/29/nyregion/unions-public-financing-elections.html
The New York Times called that opposition “unexpected,” because it just cannot accept that unions – now almost all in the monopoly public sector – are not the force for social justice they were 100 years ago, but rather one of the most selfish and self-interested collections of people in the country. A reality they just don’t want to face, but one that theologian Reinhold Niebuhr would have expected, as I noted 13 years ago.
With the amount that can be sucked out of other workers in taxes and/or cut from other services possibly maxed out, however, the New York State United Teachers and United Federation of Teachers have shifted to lobbying to provide less in exchange for the money they are already getting, rather than just getting more. The opposite of the false promise of school reform.
You might have heard about all the fights over teacher evaluation, followed by full radio silence as the issue went away. Prior to “school reform” teachers were evaluated by principals, whom after giving two “unsatisfactory” ratings might try to fight to have an incompetent or indifferent teacher removed. But the arbitration and due process rules around tenured teachers made that virtually impossible, with a burden of proof far too high for workers who work independently. Fire a teacher based on one man’s opinion? The UFT could basically stuff that by claiming that principal was a sexist, racist, biased, incompetent tyrant!
So former Mayor Mike Bloomberg took the bait, and proposed to have teachers evaluated by diverse teams of evaluators instead. The UFT immediately decided that was unacceptable too.
https://www.nydailynews.com/opinion/bloomberg-good-teachers-stay-article-1.1173064
We’ve also demanded that supervisors not base final judgments on brief “drive-by” observations that fail to capture teachers’ real skills.
So if one boss is biased, and a team isn’t around enough to provide a worthwhile evaluation, how about an objective measure like the change in the children’s score on state tests from year to year? The UFT/NYSUT responded to that by trying to get children to boycott the tests, and then ordering the legislature to prohibit test scores being used for teacher evaluation.
So what is teacher evaluation now? I would argue it doesn’t exist, not to the extent that there might be an consequences, but people are still being paid to do it.
According to one press report, Mayor DeBlasio has already agreed that the two years of unsatisfactory ratings before any action can be (not) taken be increased to three years of unsatisfactory ratings. Followed a chance at rehabilitation, arbitration, and then perhaps a court case. If the change from two U ratings to three U ratings actually happened, it happened very quietly with virtually no discussion. And then, in the last contract, DeBlasio agreed to virtually no observations of most teachers.
Most New York City teachers would be observed less often under new contract deal
Starting next fall, most New York City teachers could be judged by what principals see during just 30 minutes of instruction, in a change that addresses a persistent criticism of the city’s teacher evaluation system. Under the terms of the tentative contract deal announced Thursday between the city and United Federation of Teachers, the number of observations required for city teachers would fall in most cases to two short classroom visits.
Currently, even teachers with top scores on the city’s evaluation system must be observed four times by their principals, or three times if they also agree to let their colleagues watch them teach. Under the tentative contract, those teachers would see the number of observations required annually fall to two. For new teachers and teachers with low ratings, three or four observations would be required, down from four or six.
Might it make sense for administrators to focus on teachers who are problems and leave the majority who do a good job alone? Yes – if we weren’t talking about the UFT. Lets say a teacher, entitled to very little supervision based on the quality of their previous work, were to decide “screw it, I’m blowing off the job for the last five or ten years to retirement.” Clearly a half hour of observation a year wouldn’t be enough to take any action against them by providing a U rating. But would it even be enough proof to require a more extensive observation the following year? Not after any such attempt was taken to arbitration and the courts by the UFT.
We’ve also demanded that supervisors not base final judgments on brief “drive-by” observations that fail to capture teachers’ real skills.
The drive for lower expectations includes making sure the administrators hired to oversee New York City’s and New York State’s public schools are used to getting less, and expecting less, because they are from places where teachers and schools get less.

Consider once again New York City’s total expenditures per student at $22,386, and instructional compensation per student at $13,354, after a downward adjustment for the cost of living to make it more comparable with other areas. As the new head of the New York State Department of Education, the teachers’ union ordered the state legislature to hire MaryEllen Elia to replace “school reformer” John King. Elia was recruited to New York out of Florida, where total school expenditures per student averaged just $10,112 in FY 2017 – just half the level of NYC even after that downward cost of living adjustment, and far below the U.S. average. Florida’s instructional compensation per student averaged just $4,214, just one third what NYC teachers get even after the cost of living adjustment. Or one quarter without a downward adjustment for NYC. One quarter the teacher pay and benefits!
Has anyone asked Elia whether NYC parents have a right to expect more from their teachers in exchange for four times the compensation? Are her expectations any higher in New York than they were in Florida? My guess is nothing more, and no.
After first hiring a local who had worked in the NYC schools for decades, including the era when they were underfunded, and who later retired, Bill DeBlasio tried to recruit a new NYC schools chancellor from Miami-Dade Florida.
That district had $10,349 in total expenditures per student in FY 2017, compared with NYC at $22,386 after adjustment downward, and instructional wages and benefits at just $4,214, compared with NYC at $13,354. But he pulled out at the last minute, perhaps believing with all the money diverted out of the classroom by special interests in New York, and all the rules that allow people to not do their jobs, it is easier for him to succeed in Miami with fraction of the money.
So Mayor DeBlasio turned to his second choice, who was recruited out of Houston, Texas.
https://www.wnyc.org/story/mayor-taps-head-houston-superintendent-helm-nyc-schools/
The Houston Independent School District had $13,780 in total expenditures per student in FY 2017 (not bad for Texas), compared with NYC at $22,386 after adjustment downward, and instructional wages and benefits at just $4,133, compared with NYC at $13,354. Less than one third. Or less than one quarter, without the downward adjustment for NYC. Less than one quarter!
Has anyone asked Chancellor Carranza if his expectations of teachers are higher in NYC at four times the compensation than they had been in Texas, and in what way? My guess is his expectations are no higher, which is why he was brought here.
Needless to say, we New Yorkers wouldn’t want the embarrassment of having NYC’s sports programs compared with Florida or Texas, or its vocational education compared with just about anyplace else in the country. We are probably getting Florida or Texas education, and in those ways worse, at four times the price.
One person who, at one point, did dare to say that New Yorkers deserved far more from the schools in exchange for paying far more for them is Governor Cuomo. The United Federation of Teachers and New York State United Teachers responded with a propaganda blitz that wrecked his reputation, and their opposition is probably the reason why NYC Mayor Bill DeBlasio is running for President and Governor Cuomo is not. Eventually the NYSUT and UFT convinced Cuomo he’d better pay up and shut up or else he might not get re-elected.
http://nycdoenuts.blogspot.com/2018/04/the-uft-deal-with-cuomo-good-for.html
If you’re not paying attention to the Cynthia Nixon campaign challenging Andrew Cuomo for the Democratic Party nomination for Governor later this year, you should…. Not only was the UFT one of the unions to side with the governor, they hosted the meeting. In fact, our president threw a veiled threat out to the other unions who may have wanted to side with progressives….
While there is no telling what deal the governor made with the unions, the fact remains that the governor of New York had to turn to our union for help. It is a fair assumption to say that this will benefit it (and the other unions who side with him) in some way. Did you want Danielson to go away? Did you want the TDA percentage to be returned to the 8.5% interest level it was before the Great Recession? Did you want another shot at a new 25-55? Perhaps you wanted a cash raise or a the state to provide a stable solution to healthcare. These are now all possibilities because the governor, as the political adage goes, owes us one.
I like progressive politicians, just fine. But I like a relaxed, stable job with less pressures and fewer risks too.
Does this guy, who wants a stable solution to his health care but not anyone else’s, represent the views of most teachers? No, but then most teachers don’t bother to vote in union elections, which unlike elections for state legislature are actually contested. Moreover, this is the same union that went all out to keep the Republicans in control of the New York State Senate, in exchange for their votes on the big 25/55 pension increase, in 2008.
https://www.nysun.com/new-york/teachers-get-big-gift-from-gop/71371/
The Democrats eventually did take control of the State Senate a decade later, and will probably be ordered to put through additional pension increases that “cost nothing” sometime soon.

Needless to say, teachers in many other parts of the country have not fared as well as those in New York City and State, especially since FY 2007, and especially in low tax states such as Florida, Oklahoma, Colorado and Texas in general, and the Miami-Dade and Houston school districts in particular. If I lived in these states I might be a member of the Democratic Party. But not here.
You may hear about the situation teachers are in in low-tax places like these in the media. Somehow the media prefers not to talk about what has gone on in NYC with regard to public school spending. Note this article, which argues once again that the people of New York have cheated those who work in its public schools out of $billions based on a lawsuit from the 1990s, before NYC school spending soared to the moon. The article starts by talking about NYC, but all the data is about places other than NYC, from the same source from which NYC school spending could also have been obtained. This is the kind of sophisticated lying one sees more and more when NYC and state school spending is discussed. Lying with what is not said. There is a reason this blog is called “Saying the Unsaid in New York.”
https://www.citylab.com/equity/2019/03/education-nonwhite-urban-school-districts-funding-tax/585691/
Education coverage in the “New York” Times has been moved out of news to the Lifestyle section, where there are frequent articles about underpaid teachers in other places. Coming soon, I would imagine, would be advice articles about how pushy upper middle class parents can work the system to make sure their kid gets the teacher who does their job well, leaving the children of naïve and fairness-minded parents with the teacher who doesn’t. The kind of article the Times ran in the 1990s, before school reform. Have we gone back to the era when a campaign contribution to a state legislator got your kid the harder-working, more organized, more experienced teacher yet?
Speaking of paying up, the narrative the UFT and NYSUT, along with the Alliance for Quality Education, have pushed is that New York City schools aren’t any good because Governor Cuomo hasn’t given them enough money. As if the Governor had enough of his own personal money to pony up $billions more per year, instead of taking it from the rest of us and/or from other public services.
The federal and state public school funding per student New York City and Upstate New York receive, however, is already far higher than the U.S. average. That is true even when NYC’s funding is adjusted downward for the cost of living here. New York City’s state revenues per student, after adjustment downward, totaled $8,836 in FY 2017, compared with $6,726 for the U.S. – and $6,679 for the Downstate Suburbs, $11,732 for the Upstate Urban Counties, and $13,614 for the Rest of New York State. If NYC’s local government school revenues per student is high, it is because total spending is so sky high, not because state funding is low. The same may be said of other areas of the state.

The only nearby state getting more federal and state money per student than New York City is Vermont, where local governments cover virtually none of the cost of education. Vermont has very low local property taxes – and a virtually unique state property tax, which spreads the benefit of property taxes paid by second homeowners in resort areas around the state.

At one time, New York City might have been said to have an unfairly low share of state school aid. But that time was over by the mid-2000s, and certainly by FY 2007. From FY 1997 to FY 2007, adjusted for inflation, New York City’s state revenue per student doubled (100% increase) after adjustments for both inflation and the higher downstate cost of living. The increase was 66.8% for the Downstate Suburbs, 66.4% for the Upstate Urban Counties, and 48.2% for the Rest of New York State.
This was also the era of increased federal school aid per student, with increases of 70.5% nationwide, 74.9% for New York City, 87.5% for Upstate Urban Counties, 105.5% for the Rest of New York State, 69.7% for New Jersey, 80.3% for Connecticut, 52.4% for Massachusetts, 62.8% for Ohio, 82.6% for Pennsylvania, and 86.5% for Vermont school districts with at least 500 students.
New York City’s share of New York State school aid stopped being lower than its share of the state’s public school students back in FY 2006, going on 14 years ago. From that point forward the situation that had caused both the complaints I had made previously about the fairness of New York State school aid, and the complaints Campaign for Fiscal Equity Lawsuit, no longer existed. Every year that is further in the past.

In FY 2017, according to Census Bureau data, New York City accounted for 37.9% of New York State public school enrollment, and 38.7% of New York State School aid. In FY 2007 New York City accounted for 36.3% of New York State public school enrollment, and 40.4% of New York State School aid. But back in 1997 NYC accounted for 37.7% of enrollment but just 35.2% of state school aid, and it had been worse during the early 1990s recession, when money was tighter.

From FY 2007 to FY 2017, federal aid per student increased just 0.3% after adjustment for inflation nationwide. The huge increase from FY 1997 to FY 2007 was not repeated, but it was not reversed either.
New York City’s federal aid per student, adjusted for inflation and the local cost of living, fell 3.2%, while it increased 14.2% for the Downstate Suburbs, 10.7% in the Upstate Urban Counties, and 9.0% in the Rest of New York State. This is because NYC became relatively well off compared with these other areas, in an economy that benefitted the cities relative to the suburbs and rural areas to the greatest extent since the 1920s.
After the big increase from FY 1997 to FY 2007, New York City’s state school aid per student increased just 7.0% adjusted for inflation and the local cost of living from FY 2007 to FY 2017. This compares with an increase of 16.7% for the Downstate Suburbs, 23.1% for the Upstate Urban Counties, and 22.4% for the Rest of New York State. Part of the reason in NYC has become richer relative to these other areas over the past decade.
But part of the reason has nothing to do with actual education at all. One of the “economic development” programs of the Pataki Administration was “everybody onto the payroll and into the pension system” in the rest of the state, paid for by future taxpayers. Back then, just five years of work was enough to qualify for a (small) pension and (years of expensive) retiree health insurance. State-funded public school employment soared in areas of New York State outside New York City, and now all those retirees have to be paid for, even if there are far fewer children in the schools they once worked in. With public unions control of the state legislature, and the retired and soon to retire workers in control of the unions, that’s why money is being shifted away from NYC. There is an aspect of school aid that reflects those costs from the past, and the needs of the politically connected for jobs, not then number and needs of current students.
Even so, for the entire FY 1997 to FY 2017 period, state education assistance for NYC increased by 112.1% after adjustment for inflation (more than doubled), compared with an increase of 93.0% for the Downstate Suburbs, 104.8% for the Upstate Urban counties and 81.4% for the Rest of New York State. Other parts of the state didn’t need the extra money, but they got it anyway, as a result of a deal to increase spending everywhere.
Moving on to non-instructional expenditures…

One finds that New York City’s per student expenditures on Operation and Maintenance of Plant (including school custodians), adjusted for inflation and the local cost of living, increased by 33.2% more than inflation from FY 1997 to FY 2007, a time when the increase was 29.4% for the U.S. as a whole, and many other areas had large increases as well.
But then NYC’s per student expenditure on Operation and Maintenance of Plant soared another 81.4% from FY 2007 to FY 2017, at a time when spending on building maintenance per student was down slightly in the U.S. and close to zero, plus or minus, in many other areas.
Is this the result of the DeBlasio administration reversing any attempt to reign in the corrupt practices of the past, or the new ones of the future? Or did the use of contracted building management in some schools under Bloomberg-era reforms not turn out to be quite the deal expected, once those private contractors started making campaign contributions, like the private school bus companies and their unions?
It can’t be as bad as in the good old days before “school reform,” can it?
https://www.justice.gov/archive/tax/usaopress/2005/txdv052005may5a.htm
Click to access 11-92-Custodian-Rpt.pdf
These are reports on fraud and misconduct by NYC school custodians, from 1992 and 2001. And yet per student and adjusted for inflation, NYC per student spending on Operation and Maintenance of Plant is much higher now than it was back then!

School bus costs have soared in a lot of areas, including New York City. Remember when Mayor Bloomberg tried to implement more efficient routes, and the school bus companies got an injunction to push the change off from September to January. And then retaliated by dropping handicapped children off in the snow miles from their homes, risking their deaths?
Mayor DeBlasio got rid of some of those reforms. But no matter how much more money they get, and no matter how much more they get per child transported here vs. elsewhere, the school bus companies still feel free to treat children the same way. Even more money, or else.
http://www.wfuv.org/content/new-york-city-council-set-vote-school-bus-system-oversight-legislation
Now instead of a percent change, let’s look at changes in non-instructional spending per child in straight collar terms (adjusted for inflation and the cost of living) from FY 2007 to FY 2017, for New York City and other places. Anything jump out at you? Anything that, no matter how “progressive” and “pro-union” you are, looks like it needs to be questioned, because other workers, even Millennials, even those with no ties to the government, count for something?

To me this is all a sad and sordid tale. About people from whom, even in this sordid Generation Greed era, one might have assumed we had right the to expect better, especially the way we’ve backed them up. A tale most people don’t hear because other people don’t want to make the same admission I’m prepared to make – that two decades ago, when I was using this same data to argue for more school funding, I was a sucker, and “school reform” has turned out to be a fraud. Teachers and some others connected with the city’s; schools have been selfish, to an extent they probably don’t even understand, and are out of solidarity with other workers. And NYC unions have been a force for social injustice, one among many in the era of Generation Greed, and are out of solidarity even with their own later-hired members.
And there is no going back. The only way forward is through entirely different organizations providing education in entirely new ways through entirely new structures. The very alternatives the teacher’s unions and other unions are now desperate to get rid of, to avoid unflattering comparisons. And gradually leaving the un-reformable set of deals, favors, privileges, entitlements and victims behind. Stop trying, stop lying, and pursue alternatives.
As for “school reform” in the context of the existing NYC schools, I don’t want to hear about it anymore. If someone were to suggest “school reform,” my response would be to ask which retroactive pension increases they were referring to.
